Rwanda's poultry statistics disagree with each other by a factor of six, and the 2026 press
figures for egg output turn out to be the government's own planning targets reported as
achievements. So nothing here is asserted. Each figure names its survey, strategy document
or breed manual, and where the sources conflict we say which one we chose and why.
Conflicting sources — we name the one we tookAlways
Claims about Hedge raising yieldNoneWe looked for the evidence and did not find it. See "What we do not claim" below.
Curated1 Aug 2026
The national record
What Rwanda measures, and what it is measured against.
Two columns: the figure the Rwandan record actually reports, and the figure the genetics or
the manual are rated for. The distance between them is not an opinion about farming — it is
the distance between two published documents.
The national record
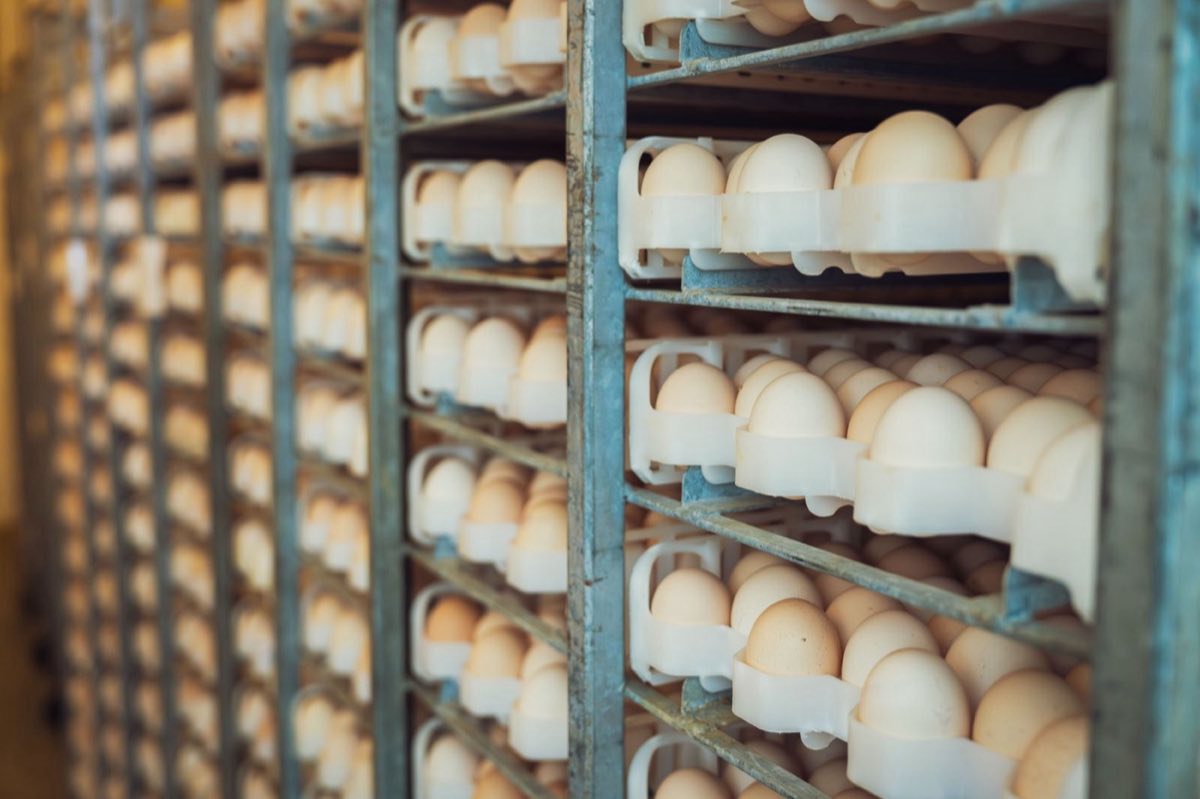
Counted in one year112,856,811eggs
A national survey can count this to the egg. What it cannot tell you is which of your
houses produced which tray — the record stops at the border of the farm, and everything
below that line has to be kept by you.
NISR, Agricultural Household Survey 2024, Table 54
Scale
Herd and flock, latest survey
Population
Head
Share
Source
Pigs
1,006,890
—
NISR, Agricultural Household Survey 2024
Layers
1,272,783
33% of the flock
NISR, AHS 2024, Table 45
Broilers
240,711
6.2% of the flock
NISR, AHS 2024, Table 45
National chicken flock
3,860,000
—
NISR, AHS 2024
Eggs produced, survey year
Sixty-eight per cent were sold, so the constraint is not demand.
112,856,811
68% sold
NISR, AHS 2024
Field versus standardThe gap is between two documents
What is achieved, against what the manual is rated for
Measure
Rwanda today
The standard
Gap
Eggs per hen, to end of cycle
Rwandan yield is measured to 90 weeks and the breed objective to 100, so the gap understates nothing — those ten weeks eat feed too.
360ISA Brown in Rwanda · Netherlands 2019
476Hendrix Genetics / ISA objective
−116 a hen
Layer flock mortality
A national planning baseline against a breed liveability figure. We use the kinder end of the manual's 5–7% range.
20%MINAGRI Livestock Development Strategy 2024–2029
5–7%Lohmann Brown-Classic, liveability in lay 93–95%
13 points
Broiler slaughter age
42–45 days2.4–2.5 kg at a commercial integrator · Netherlands 2019
35 daysCobb 500 at 2,521 g, cumulative FCR 1.441
7–10 days
Cumulative feed per broiler
5.100 kgCobb 500 table, day 42
3.635 kgCobb 500 table, day 35
+1.465 kg a bird
Broiler stocking density
5–10 / m²Netherlands 2019
4–5 / m²CASA recommendation
up to 2×
Pig farms keeping any record
38%Mbuza et al., Int. J. Livestock Production, 2016
90% by 2028/29PSTA 5 compulsory registration target
52 points
Pigs
Structure of the sector
◦90–95% of farms are smallholdings of one or two sows; fewer than 100 commercial farms nationally Frontiers in Veterinary Science
◦Slaughter slabs keep no records at all Frontiers in Veterinary Science, pig value-chain mapping
◦RWF 5,000 deducted per cysticercosis cyst — 20–40% of a medium pig's value Frontiers in Veterinary Science
◦Purchased birds outnumber home-hatched ones eight to one NISR, AHS 2024
◦Which means nearly every layer arrived with a published performance specification attached
◦Breed intake for the same genetics: 112 g a bird a day ISA / Lohmann management guide
Broilers
The market at the end of it
◦Domestic chicken meat market worth RWF 153 bn — thirteen times the egg market CASA, 2020
◦Margin of RWF 1,000 on a bird sold at RWF 3,000 CASA
◦RWF 16,000 to rear a layer to point of lay CASA
Market signals
Costs are moving faster than prices.
Rwandan food inflation is the mildest major component in the basket. Everything a farm buys
is not. You are absorbing energy at six times the rate you can pass on at the farm gate.
Headline inflation, year on year
Food and non-alcoholic beverages — the mildest major component
FastestEnergy — six times the food figure
Of its dollar value the franc gave up, 2020 to 2025
NISR consumer price index, June 2026 · exchange rate from a daily public feed ·
rings drawn proportionally on a 0–50% scale · curated 1 August 2026
Indexed, 2020 = 100
What five years did to your two biggest inputs
FEWS NET / e-Soko · daily public exchange feed · both endpoints are published; the bars index them, they do not model a path
Divergence
Watching Chicago will not tell you what the ration costs
Rwandan maize is rising 14.5% year on year while the world price falls 8.8% month on
month. The local feed market is not tracking the global one, so a hedge read off an
international benchmark is a hedge against the wrong thing.
RWF 560per kilo, national average across 26 markets · FEWS NET / e-Soko, May 2026
The practical consequence: the only reliable forward view of your feed cost is your own
purchase record, priced per ration, per house, per week.
Inputs
What the inputs are doing
Signal
Latest
Change
Source
Maize, national average across 26 markets
The single biggest line in a poultry ration, and the one that sets your feed invoice.
RWF 560/kg
▲ 14.5% y/y
FEWS NET / e-Soko, May 2026
Maize, five-year move
—
▲ 139%
FEWS NET / e-Soko
Maize, world price
Falling, while Rwanda's rises. The local feed market is not tracking the global one.
USD 197.1/mt
▼ 8.8% m/m
World Bank Pink Sheet
Soybean meal, world price
The protein side of the ration, and it is still climbing while maize falls.
USD 425/mt
▲ rising
World Bank Pink Sheet
Rwandan franc against the dollar
Premix, vaccines, day-old parent stock and equipment are all imported and priced in dollars.
1,472.39
▲ 51.4% since 2020
Market mid-rate, 1 Aug 2026 · not the BNR official rate
Agriculture's share of all bank lending
Nineteen per cent of GDP, financed by under three per cent of the credit. A lender who cannot read your record cannot price your risk.
2.7%
— of the loan book
NISR / BNR
One number is missing here on purpose. There is no current published Rwandan egg price.
The WFP series ends in 2015 and FEWS NET carries no eggs at all — so the thing a layer farm
actually sells is, nationally, unmeasured. Every farm we have worked with knows its own gate
price to the franc and can produce it in seconds; the country cannot. That asymmetry is the
whole argument for keeping the record, and it is why we would rather show you an absence than
an invented figure.
What we do not claim
The honest version of the "software raises yields" slide.
We went looking for evidence that record-keeping software raises output. The best-controlled
study we could find says it does not — and we would rather publish that and argue the other
side of it than quote a number we cannot stand behind.
The study
What record-keeping is actually proven to do
912 dairy herds, software users against non-users. First calving came two and a half
months earlier, and the modelled marginal return on the software was 163%. It found
no significant difference in yield.
Journal of Dairy Science, Costa RicaOur reading
So we argue the other side of it
Records do not make an animal produce more. They make the losses visible — and in African
smallholder poultry those run to half the flock, with three-quarters of brooding chicks
lost. A Kenyan study of 1,908 households found 70% of all off-take was involuntary loss,
and 12% had reached a vet.
FAO · Kenya household surveyAI
Where the machine sits, and where it does not
Reading a photographed tally sheet, mapping an unfamiliar spreadsheet column, and
answering a question in plain language. It never invents a figure: every answer opens the
screen and the rows it came from. We publish no claim that AI raises output, because we
found no evidence for one.
Sustainability
What it means here, and nothing more
A bird that dies has eaten its feed and produced nothing — the emissions of the whole
flock, divided across fewer eggs. Commercial layers convert 2.3 kg of dry matter per kg of
egg; backyard flocks need 9.2. Cutting loss is the cheapest decarbonisation a farm has,
and it happens to be the same work as cutting cost.
FAO GLEAM · Poore & Nemecek 2018
Method
How these figures are chosen, and how they are kept.
1
A named source, or it does not appear
Every figure traces to a survey, a strategy document, a breed manual or a public price
feed. If we could not find one, the figure is not on the site — which is why some
obvious-looking numbers are absent.
2
Conflicts are declared, not smoothed
Rwanda's poultry statistics disagree by a factor of six depending on the source. Where
we had to choose, we say which we took and why — and we take the conservative side of
any range that flatters our argument.
3
Assumptions carry a dagger
Two inputs in the gap calculator are ours rather than cited — the feed price and the
days of downtime between broiler placements. Both are marked, both are editable, and
the legend names them.
4
Targets are not achievements
The 2026 press figures for Rwandan egg output turn out to be the government's own
planning targets, reported as results. They are not used anywhere on this site.
5
Everything carries a date
Market figures are curated, not live, and say so. Where a figure can be refreshed from
a public feed on a schedule, it will be — and it will still carry the date it was last
read.
Refresh
Which figures move, and how often
Cadence by source
Source
Cadence
Exchange rate
Daily public feed
World Bank indicators
Weekly
World Bank Pink Sheet
Monthly
FEWS NET market prices
Monthly
NISR surveys and CPI
As published
Breed manuals
On revision — rarely
Scheduled refresh is being wired; until it lands, every market figure on this site is dated and curated by hand.
Corrections
If a figure here is wrong, tell us
We would rather correct a number than defend it. If you hold a source that contradicts
something on this page — particularly a current Rwandan egg price, which we could not
find — we want to see it.